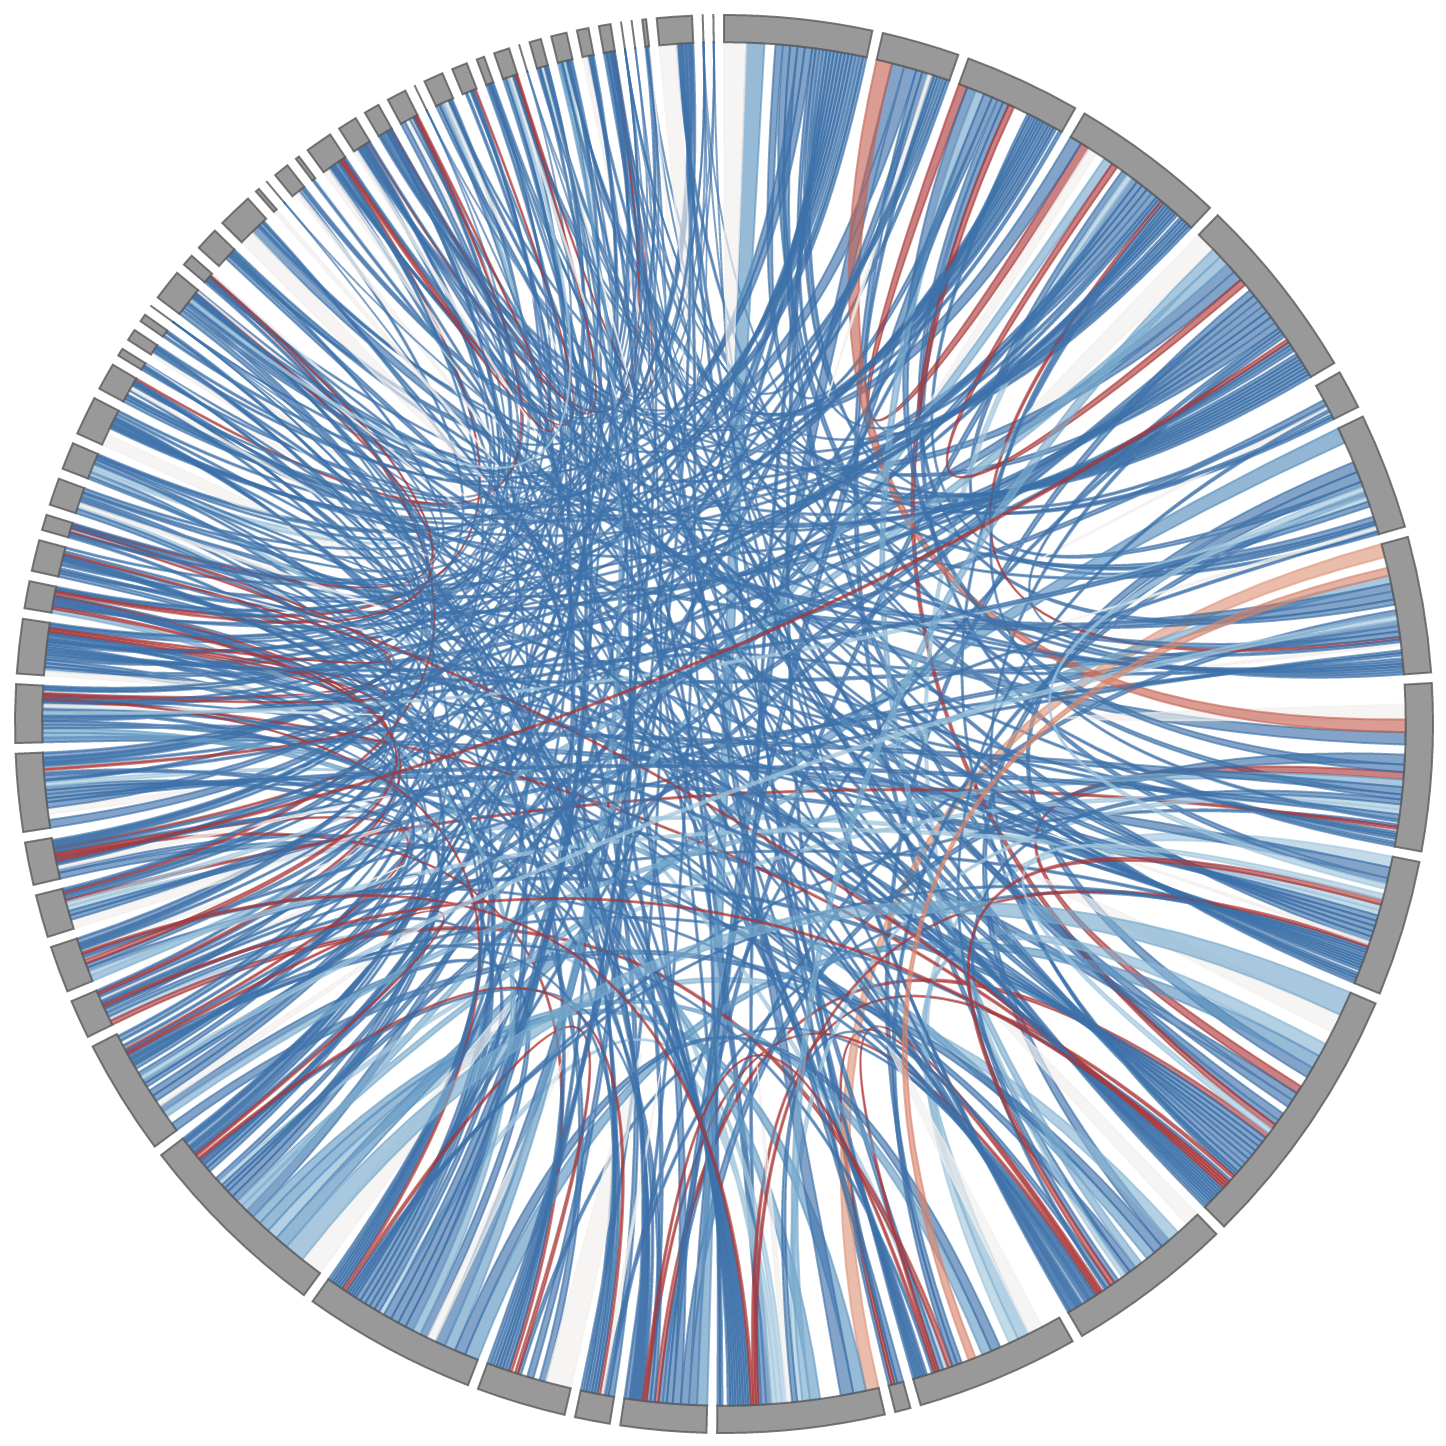
Data & Code: Consensus and Fragmentation in Academic Publication Preferences
Survey data and reproducible code from a study of publication venue preferences among 3,510 US tenure-track faculty. Includes 153,654 pairwise venue comparisons, metadata for 6,363 academic venues, and Python scripts to regenerate all main figures and supplementary analyses. Companion to Van Buskirk, Hohmann, Landgren, Ugander, Clauset, and Larremore (2026).
[GitHub]
Data & Code: Quantifying hierarchy and dynamics in US faculty hiring and retention
These data visualizations, datasets, networks, and code are all companions to Wapman, Zhang, Clauset, and Larremore. Nature, (2022).
[Explorable data visualizations]
[Data]
[Code]
Calculator: Online Serial Screening Policy
The impact of a serial testing policy depends on the test's frequency, turnaround time, and sensitivity, as well as the underlying viral kinetics. This calculator allows users to explore various potential parameters of each.
[Screening policy calculator]
Calculator: Online Bayesian Prevalance
It is well known that estimates of prevalence are directly affected by the sensitivity and specificity of the diagnostic test being used. These calculators enable users to quickly compute Bayesian posteriors of prevalence, given field data and known sensitivity and specificity OR field data and lab validation data. This latter calculator recognizes the fact that sensitivity and specificity, themselves, are quantitites derived from data, and may thus be modeled jointly to estimate prevalence.
[Prevalence calculator, known sensitivity and specificity]
[Prevalence calculator, lab validation data]
Data: Paid Parental Leave Policies
Inspired in part by a study of university parental leave policies by Antecol et al. (New York Times, Inside HigherEd), we collected the paid parental leave policies for tenure-track faculty at 205 research universities in the US and Canada. The purpose of this post is to share the data we collected, highlight the complexity of many such policies, and share some preliminary analyses. Thanks to a tip from Laura Noren, we then obtained a dataset of paid parental leave policies for roughly 100 tech companies, crowdsourced by tech employees and community members after being started by Aaron Harnly of Amplify.
[academia]
[academia + tech]
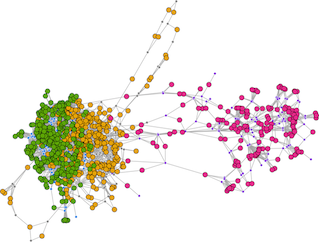
Code: webweb

webweb is a tool for creating, displaying, and sharing interactive network visualizations on the web, designed for simplicity and ease of use. With just a few lines of python, networkx, or matlab, webweb will build and launch a visualization in your browser.
[installation and docs]
[github]
Code: biSBM (bipartite Stochastic Block Model)
The bipartite SBM is a model for finding community structure in bipartite networks. The Python version automatically chooses the number of groups using nonparametric Bayesian approach while the other implementations are parametric and require the user to choose the number of groups.
[github (python)]
Calculator & Code: Bayesian Repertoire Overlap
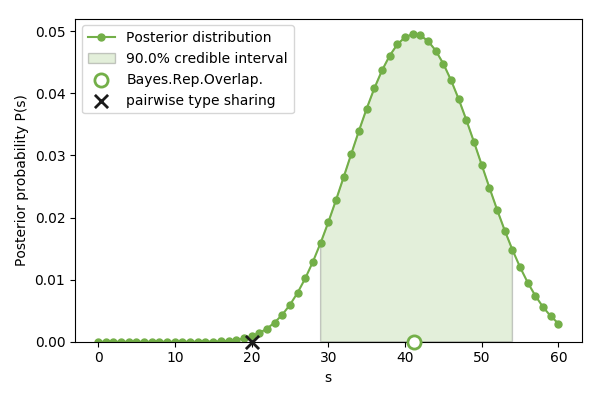
Bayesian Repertoire Overlap is a method to estimate the number of shared var genes between two parasite repertoires, based on a limited number of samples from each repertoire.
[github]
[online tool]
PercoVIS

PercoVIS is a free software tool, created to visualize the process of percolation on a network. It includes Erdos-Renyi and Adjacent Edge decision rules for link addition, as well as the Social Climber attachment model. Documentation about these processes can be found on the download page.
[github]
MATLAB: findNetworkComponents
Take an undirected network adjacency matrix and return the number of components, their sizes, and their membership lists.
[MATLAB file exchange]