COVID-19 Testing Group
The COVID-19 Testing Group is a community resource for sharing COVID-19 prevalence, seroprevalence, and burden studies, as well as planning tools and data. This website is maintained by the Larremore Lab at the University of Colorado, Boulder.
Surveillance policy calculator
This calculator accompanies the manuscript "Surveillance testing of SARS-CoV-2." This work is not yet peer reviewed.
This calculator considers the impact of a surveillance policy on individuals and populations by explicitly including the interaction between testing and viral load trajectories. Here, a surveillance policy has 3 inputs:
- Test limit of detection. (For PCR, we suggest 3.)
- Test frequency, measured in days between tests. (e.g. 7 for weekly testing)
- Test sample-to-answer delay in days. (e.g. 1 for a one-day delay in results)
| Surveillance policy | |
|---|---|
| Viral load sensitivity (log10 cp/ml) | |
| Days between tests | |
| Sample-to-answer delay (days) |
| Viral kinetics | ||
|---|---|---|
| Incubation time (min, max) | ||
| Then time before peak (fixed, gamma shape) | ||
| Peak viral load, log10 (min, max) | ||
| Time between peak and 1e6 (min, max) |
Reproductive reduction factor: R= × R0
Please report bugs with screenshots to daniel.larremore@colorado.edu. Visualization source code is on Github.
[Lines]: 100 viral load trajectories are drawn from the model. Hover over trajectories to see discrete-time values and model control points.
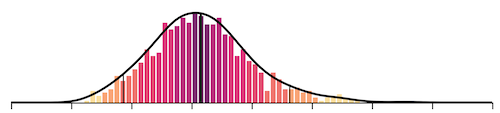
[Bars] Infectiousness is removed from the population due to the self-isolation of symptomatics and by surveillance-driven isolation. The relative improvement of surveillance (R-intervention) over no surveillance (R0) can be computed to estimate the impact of surveillance on the reproductive number, below the plot.
[Scatter] Surveillance need not catch every case to be broadly effective, but its implications for individuals are still important. The infectiousness of 100 individuals for no policy and for the surveillance policy are show as dots. If the policy misses an individual's infectious period due to lack of test or delay in results, the dot is blue.