Quantifying hierarchy and dynamics in US faculty hiring and retention
This page is a companion for the Nature article Quantifying hierarchy and dynamics in US faculty hiring and retention, written by Hunter Wapman, Sam Zhang, Aaron Clauset, and Daniel Larremore. It hosts visualizations of patterns in US faculty hiring, links to deidentified data and replication code, and a record of corrections and updates to the paper and the data.
Journal Reference
K. H. Wapman, S. Zhang, A. Clauset, and D. B. Larremore, “Quantifying hierarchy and dynamics in US faculty hiring and retention.” Nature 610, 120–127 (2022).
K. H. Wapman, S. Zhang, A. Clauset, and D. B. Larremore, “Author Correction: Quantifying hierarchy and dynamics in US faculty hiring and retention.” Nature 619, E49 (2023). See corrections and updates below.
Interactive Data Visualizations
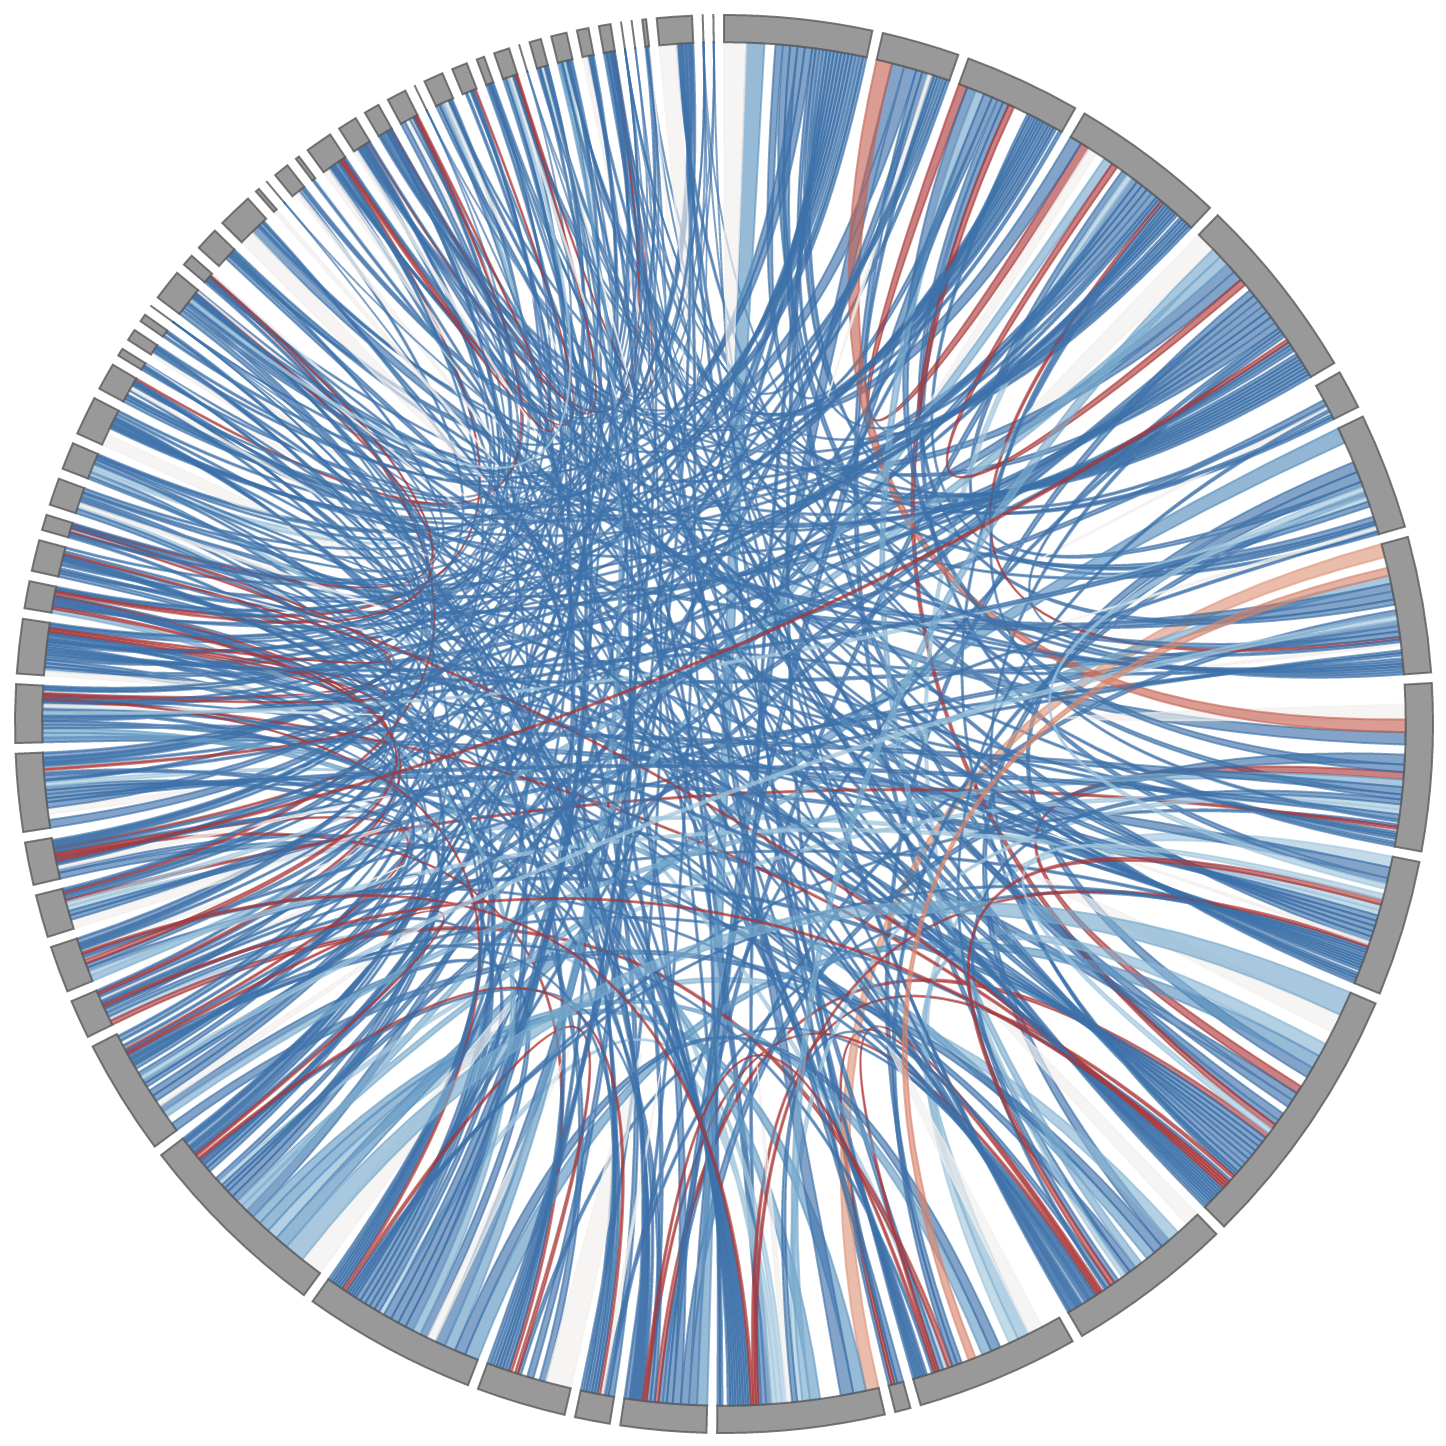
move between universities
when they become professors.
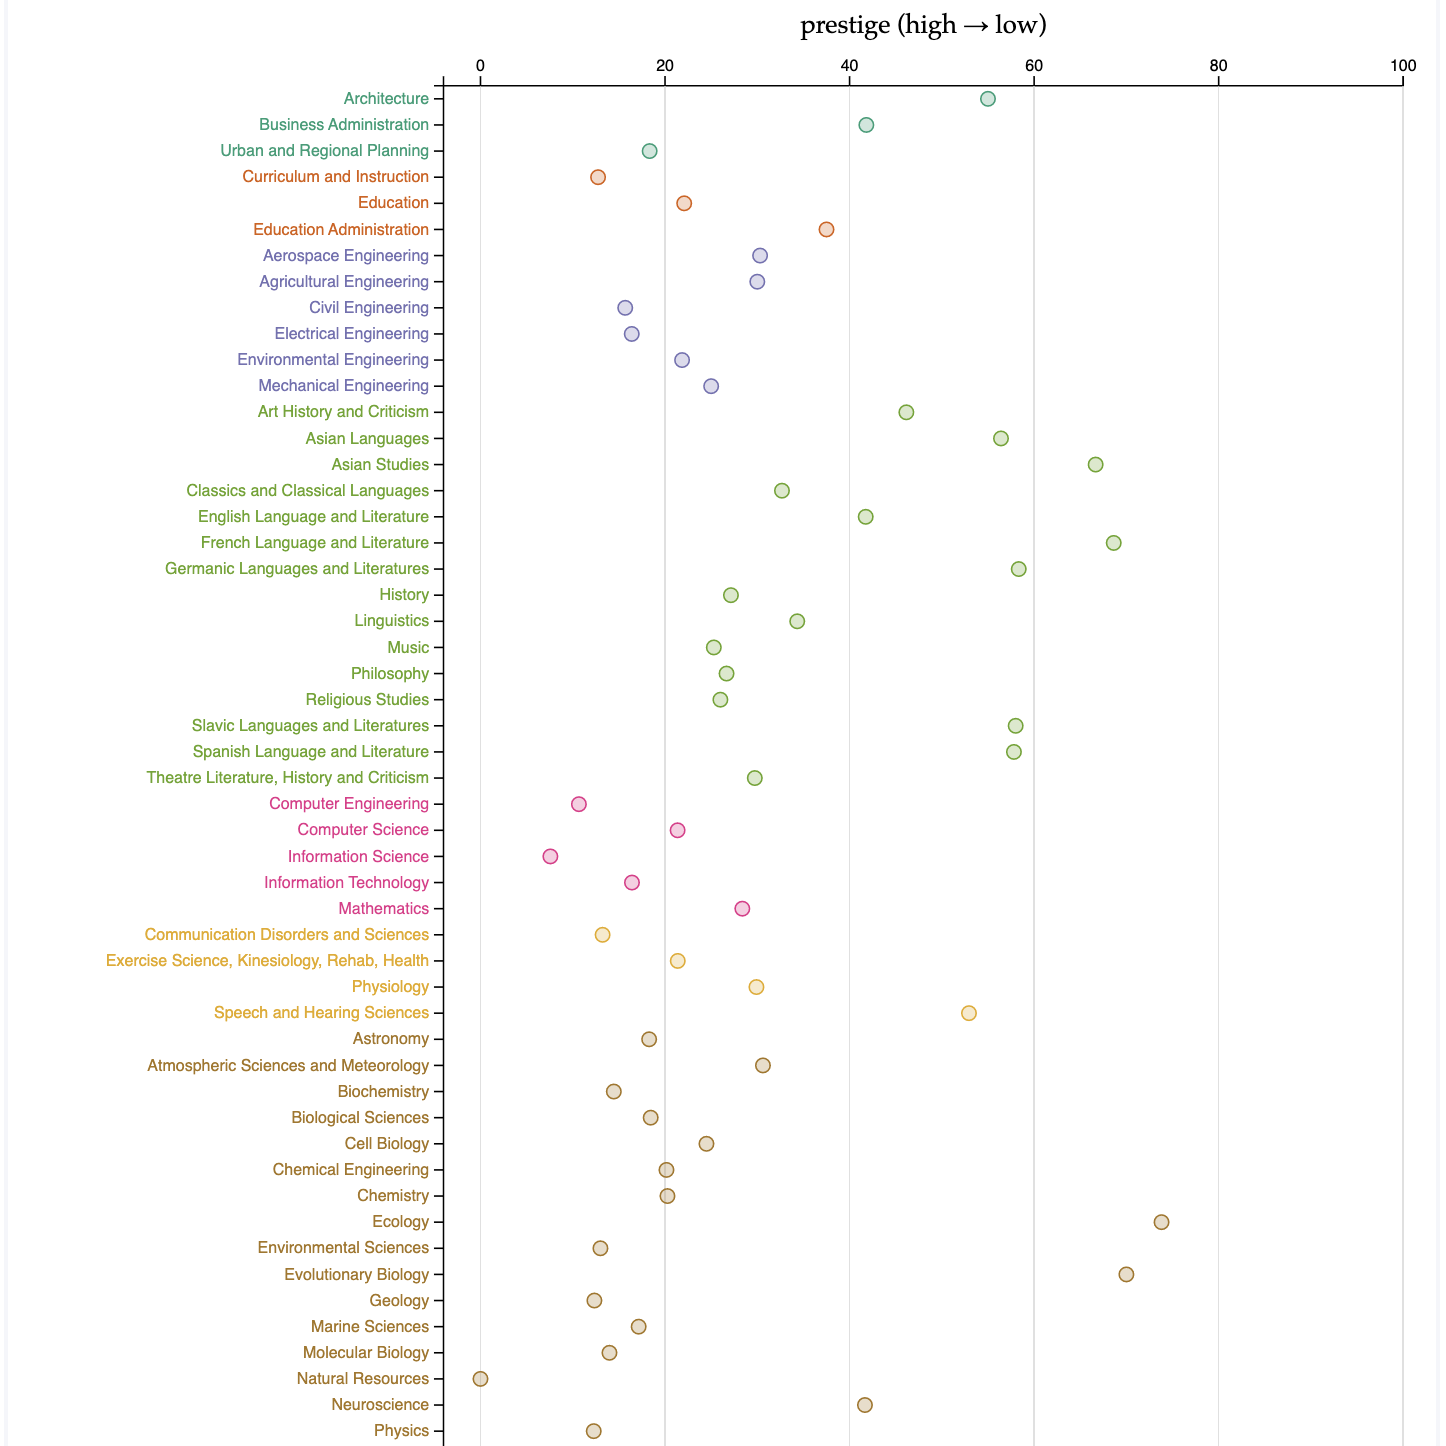
rank, as measured by
prestige1 or production2.
1 A university’s prestige rank is a measure of its ability to place its graduates as faculty at other prestigious universities. We use SpringRank to infer prestige hierarchies across academia in toto and, separately, in each domain and field. In order for a university to have a prestige rank in a given field, it must employ faculty in that field; doctoral universities that do not themselves employ faculty in that field are removed from the network before ranking.
2 A university’s production rank is a measure of how many faculty it has trained. Production ranks are calculated for academia in toto and, separately, for each domain and field. In order for a university to have a production rank in a given field, it must have trained at least one faculty member who is employed in that field.
The visualizations cover 122 networks: academia, 10 domains, and 111 fields. Two of the domains (Public Administration & Policy; Media & Communication) and their fields were excluded from the analyses in the paper and are not in the public data files.
Data and Code
The Zenodo links are concept DOIs and always resolve to the latest version of each record.
Corrections and updates
July 2023 — Author Correction to the paper. The Methods section originally described two criteria for identifying new hires, but the analyses used one: faculty were labelled as new hires if they earned their degree within 4 years of their first recorded employment as faculty (59,007 new faculty, 20.0% of the faculty in the dataset). The text of the paper was corrected to match the analyses that were performed; the results are unchanged. Author Correction, Nature 619, E49 (2023).
August 2026 — Update to the public data files. The four data files in the us-faculty-hiring-networks repository were regenerated from the original analysis pipeline — same underlying data, sample, and rankings — to fix several bugs in the step that exported them. In particular, about 2,800 ranked institutions were missing from institution-stats.csv, leaving gaps in the ordinal prestige ranks; attrition is now reported in two explicit units (faculty and faculty-years); the empirical FractionUpHierarchyHires in stats.csv was restored; 6,134 artifact rows were removed from edge-lists.csv; and the README was corrected. The full list is in the repository’s changelog. We thank Todd Jones (Mississippi State University) and Alex Bell (Georgia State University) for finding and diagnosing the missing institutions. The interactive visualizations on this page were built directly from the pipeline and were not affected.
Copyright 2022–2026, Hunter Wapman & Daniel Larremore